|
|
|
|
|
|
|
|
|
|
|
|
|
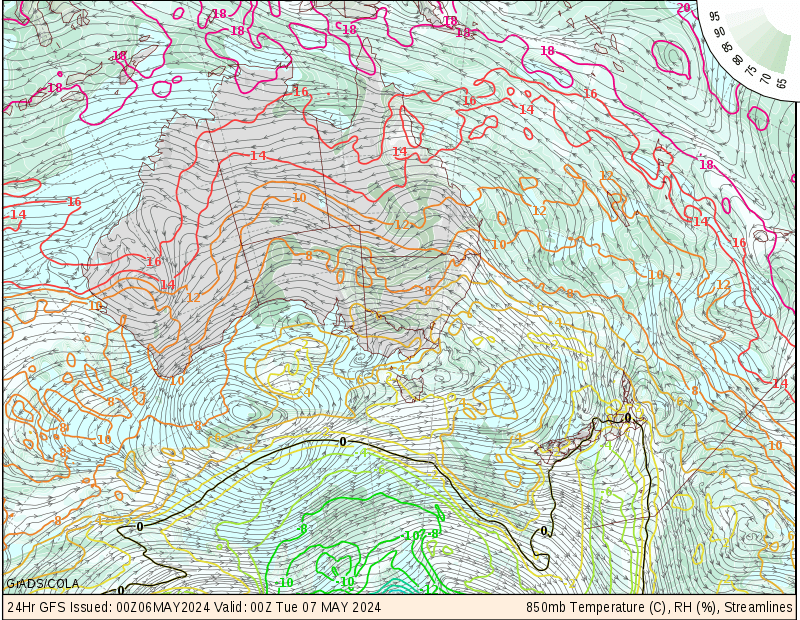
The panels below are prepared twice daily from the US GFS model. They are produced by COLA, and come online about 5am and 5pm EST. The first panel shows expected average temperatures over the next two weeks. The following panels show expected conditions at about 1.5km (at the height where pressure = 850hPa) and are the most useful charts for forecasting snow in winter and hot weather in summer. They show:
Snow is likely when the temperature at your altitude is less than about 2C, humidity is high, and there's enough uplift to cause precipitation. If you want to keep it simple, snow is a distinct possibility above about 800 to 1000m asl when the temperature is below zero and there's lots of green (humidity)! Hot weather is likely when the 850 temperature is above about 20. The boxes above right show the layout of the weatherwall. Be sure to check that the charts are current. |
|
|
|
|
|
|
|
|
|
|
|
|
![]()